Categories
Logging Data via the Database Contribution Log

Logging Data via the Database Contribution Log

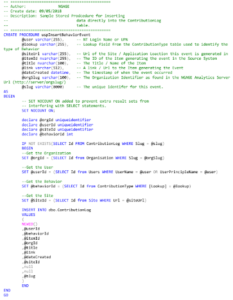
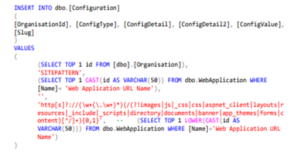
For applications where you track different database activities, adding data directly to the NGAGE Analytics Server’s database in the ContributionLog table is the most performant method. The sample stored procedure below shows how to insert data into the ContributionLog table.

Categories
Adding web application meta-data

Adding web application meta-data

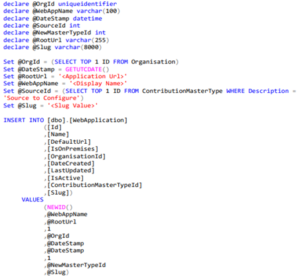
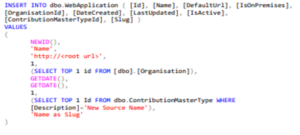
When a new Source is defined it must be associated with a new web application Url for reporting purposes. In the case of applications like web sites or hosted software this is simply the Url of the application your users would access it by. But, if your application is not web based you still need to define a Url / Description for your application to enable reporting.

Adding new web application meta-data is currently only available via SQL script direct into the NGAGE Analytics Server Database.

Categories
Logging Data via IIS Logs

Logging Data via IIS Logs

An application’s IIS Logs are suitable for import into NGAGE if they provide detail for the GET requests for pages within the application. For example, NGAGE requires logging of calls to asp, aspx, html or documents to be able to analyze page views and document downloads. Traditional/legacy applications can usually provide this type of detail. Modern REST based applications may struggle to provide a complete picture of usage via the logs alone. In these cases it is often necessary to augment (or replace) the logs with specific event tracking using the REST API. If your application is suitable for IIS Log import the following steps are required:

  1. Verify that you are logging in the supported format; W3C with all fields checked.
  2. Create a new Source for the application. For example if your application is a Document Management system, you could choose to call it “Document Management”.
  3. Setup the root web application URL in the NGAGE Intelligence database.

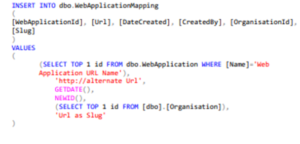
  1. Any additional URLs (alternate URLs) found in the IIS Logs should be added to the database too. This ensures all URLs are mapped to the root URL to provide consistent reporting.

  1. Setup the Configuration meta-data to define the rules around creating sites from the IIS path data. The creation of Sites within the Web Application provides a richer reporting experience for end users. The Critical columns are:
  2. configType = SITEPATTERN
  3. configDetail = WebApplicationID
  4. configValue = RegEx, using pattern templates below. change the {0,1} to be however many levels you want created; {0,1}=1 level, {0,5}=5 levels, etc.
  5. Also note that there is an exclude list in the RegEx that can be modified (highlighted). Any pipe separated term defined here will be ignored as a Site name.

‘http[s]?://(\w+(\.\w+)*)(/(?!images|js|_css|css|aspnet_client|layouts|resources|_include|_s cripts|directory|documents|banner|app_themes|forms|content)[^/]+){0,1}’

  1. Copy the application’s IIS Logs to the NGAGE SSIS file drop location using the supplied PowerShell script on a nightly basis.
  2. Run the SSIS import.
  3. Data from the new import will now be visible in the Cube and Reports (subject to filtering).

What is tracked?

Below are top 3 things which we are tracking except of data from audit logs :

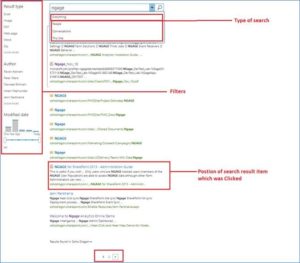
1.Search Analytics Data From (BAI JS only classic) such as “Total number of results in search page” , “Filters and types of filters used ” , “Site , People and Enterprise search tracking” , “Position of search result item which was clicked”

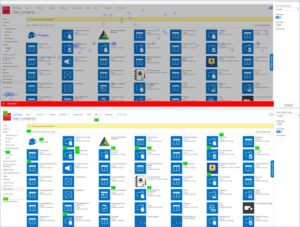
  1. Page Click Map and Heat Map (Modern and Classic)(Using JavaScript ). Tracking Page view and Page clicks

3.Teams Analytics  (Using Graph API’s)

  • Teams user activity
  • Channel messages analytics (Reaction, Mention, Attachments)
  • Discover your team’s collaborative culture.
  • Determine team interaction patterns to optimize collaboration.
  • Find out what your team type is.
  • Find most active channels, most engaging posts and influencers. etc


  1. Teams Analytics  (Using Graph API’s)
  • Teams user activity
  • Channel messages analytics (Reaction, Mention, Attachments)
  • Discover your team’s collaborative culture.
  • Determine team interaction patterns to optimize collaboration.
  • Find out what your team type is.
  • Find most active channels, most engaging posts and influencers. etc

Why nGgage instead of the audit log in the Security & Compliance Center

O365 does have an audit log in the Security & Compliance Center    But the logging isn’t as deep as customers really want.

See Knowledge article:  Why nGage


Why Nage?

NGAGE can function as an item and user level audit tool for SP Online, Teams and Yammer.  But that’s never why NGAGE is bought. It’s not what drives demand for holistic analytics tools like NGAGE.

What our customers mostly want is to be able to look at the behavior of different segments (Job Titles/ Offices/Departments etc) of their organization in relation to their SP Portal or Teams subscription. They especially want know where in the organization there are low levels of adoption and engagement – so they can intervene and learn what works.

In SP Online they want to know which Sites/Site Collections are attracting the most/least traffic. Which ones have stale and redundant content that is undermining the credibility of the portal.

And they want to be able to see the trends over time in relation to all of the above. Not just the answer to ad hoc queries which is what the this feature provides.